Skip to content
Start off the year with a subscription to must-have market data
Start off the year with must-have market data
Supplement Business Report 2023

Click the top image for a full-screen preview of each page

Supplement Business Report 2023

$4,495.00

One of NBJ’s most looked forward to times of the year is the release of our annual Supplement Business Report and the launch for the 2023 update is no different. Commentary across the industry has been consistent with observations supporting that the market is normalizing post covid. The decline in some categories is expected, what’s unexpected is the increase across channels not predicted to have the level of growth we're seeing.

The 2023 Supplement Business Report is packed full with over 150 charts, a top 50 company list, and data backed commentary that’ll give you an understanding of how the industry has developed in the past year and forecasting where it's heading through 2026.

What are our biggest takeaways?

  • Even with the post-covid market normalizing, it is still more lucrative than we expected it to be in 2019.
  • E-commerce is stalling in growth, and we’ve seen an unexpected increase across other channels as a result.
  • Over the past few years, NBJ has tracked the largest and lowest growth swings ever across the industry.
  • Top 50 company list

Pick up where the Supplement Market Economy Update Report left off with the 2023 Supplement Business Report


Subscribers receive 10% off!

Not a subscriber?

Learn More

Already a subscriber?

Email nbjsubscriptions@newhope.com for your discount

Each chapter contains action items to bring the insights into your day-to-day

For the MarketerFor the Product DeveloperFor the CEO/Executive

Over 150 Market Sizing Charts & Graphs

Category-by-category analysis with projections through 2026

List of Top 50 Companies

Raw Data + PPT Slides

Sales, growth, and analysis across 6 sales channels

NBJ’s annual report detailing the industry by category and sub-category

Table of Contents

Click through each tab for an overview of each chapter and its data charts and survey questions.

Download the Table of Contents

Executive Overview

Vitamins

Minerals

Herbs and botanicals

Sports nutrition and meal supplements

Specialty Supplements

Sales Channels

Company profiles

Related Content

Acknowledgments and definitions

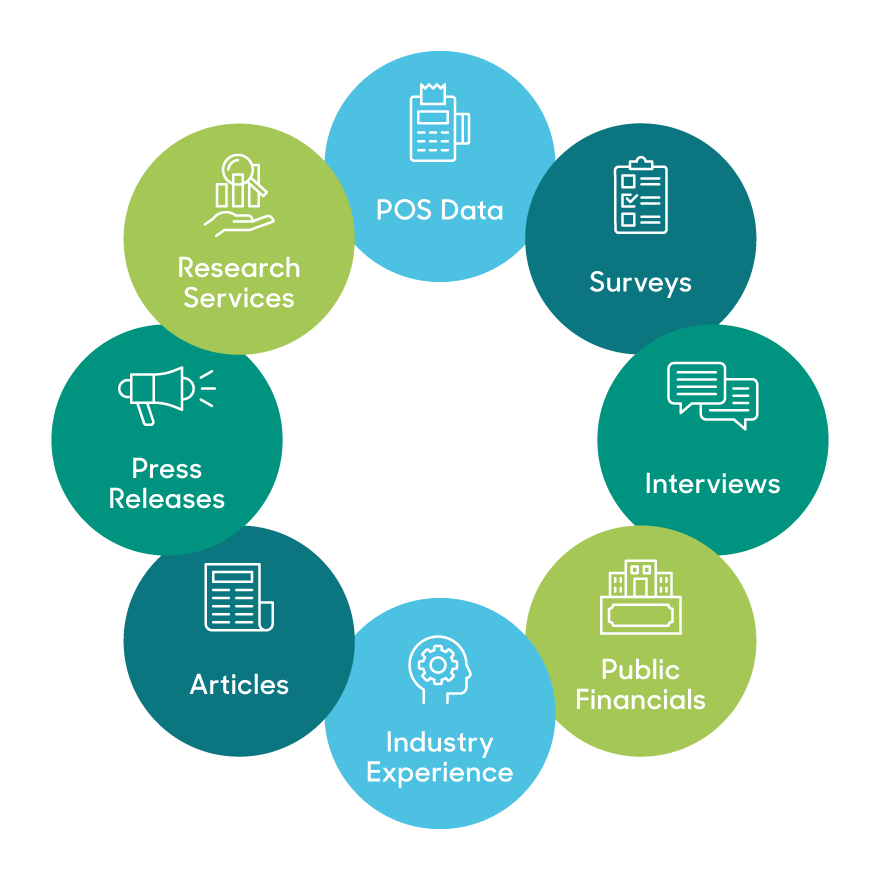
The NBJ model pulls from myriad data sources, outlined in our Methodology. Critical to our outputs are partnerships with SPINS, which powers our retail data and understanding, and ClearCut Analytics, whose Amazon data supports our e-commerce projections.

Powered by

SPINS

Ecommerce model supported by

ClearCut Analytics

Our unique methodology tells you

  • what people are buying
  • where they're buying it
  • why they're buying it

Learn how this multi-input data model provides a comprehensive view of the industry and delivers the most accurate forecasts 

Explore Our Unique Model

Testimonials

Gaia Herbs

Director, Brand Strategy

"As a brand and product development leader in the natural products industry, I have always relied on NBJ as valuable and primary sources for credible industry data and actionable insights on emerging trends."

Megafood

Director of Marketing

"NBJ Reports are used by our Exec Team, Brand/Mktg/Sales leaders to support data-based decision making and gives us industry and competitive insights."

Native Botanicals

Owner/President

"The data and information vividly reflects the trends, challenges, regulatory impacts we have experienced as we have grown into the ‘adult-hood’ of an industry we are today"

Trusted by:

Glanbia
DSM
Lonza
NOW
Pharmavite

Featured in:

Entrepreneur
Washington Post
Consumer Reports
Fast Company
Yahoo Finance